SCAN At-Home COVID Testing Kits
Qualitative research and remote usability testing for the Brotman Baty Institute on an at-home COVID-19 swab kit used by 25,222 participants.

Background
SCAN was losing participants inside a procedure nobody had watched first-hand
The Greater Seattle Coronavirus Assessment Network (SCAN) was a joint COVID-19 study run by the Brotman Baty Institute. Participants enrolled online and collected their own nasal swab at home, which extended testing to people who never reach a clinic. That same design meant the study had no view of what happened between mailing a kit and receiving a swab back, and participants were dropping out somewhere in that gap. SCAN asked us to find out where.
Deliverables
Usability Test Structure and Design
Qualitative Analysis of Observations
User Journey of SCAN Procedure
Report with Findings & Recommendations
Role
UX Researcher,
Usability Test Moderator,
Data Analyst
Timeline
30 weeks
Industry
Healthcare, Medical Devices,
Informatics, Medical Research
Exploratory Research
The data SCAN already held told us where to look
We started with a mixed methods analysis of the SCAN participant datasets: a post-study survey sent to every participant, the procedural data, and the support emails participants had written to the study. There was enough of it to narrow the scope and decide which parts of the procedure were worth observing directly.
25,222
PARTICIPANTS ENROLLED
1,803
POST-STUDY SURVEYS ANALYSED
Hypotheses
Three steps accounted for most of the reported trouble
The analysis pointed at three problem areas. We wrote a hypothesis for each and designed the usability study to test them.
46.5%
of recorded drop-offs occurred at the kit registration step
Hypothesis
Participants have difficulty completing kit registration and abandon the study at that step.
38.7%
of reported issues concerned kit pick-up or drop-off
Hypothesis
Participants are not given sufficient pick-up and drop-off times or instructions for their kits.
14.7%
of survey respondents reported that the instructions were unclear
Hypothesis
The Quick Start Guide, the pamphlet of step-by-step instructions in every kit, is not guiding people through the procedure.
Usability Testing
Ten participants opened a kit on camera and talked through it
Ten participants completed the usability test, all of them remotely over Zoom. Each session opened with participants describing their experience up to that point, covering enrollment and kit delivery. They then completed the kit while thinking aloud, and finished with questions about the swab itself and what they expected of the results process.
Three to four days later, one member of the research team called each participant back for five to ten minutes to ask how the test had felt in retrospect and how they had found receiving their results.
Analysis
Every recommendation traces back to something a participant did on camera
We coded each interview and pulled out the insights and themes that recurred. Affinity diagramming grouped those insights and gave us the starting points for recommendations. Anything that could not be traced to a direct observation of a participant did not become a recommendation.
User Journey
The trouble clustered before the swab, not during it
The research team built a user journey map to place the pain points inside the procedure. We split the journey into four stages: recruitment, sign-up, kit completion, and awaiting results. For every action within a stage we coded the observed experience as positive, negative, or neutral.
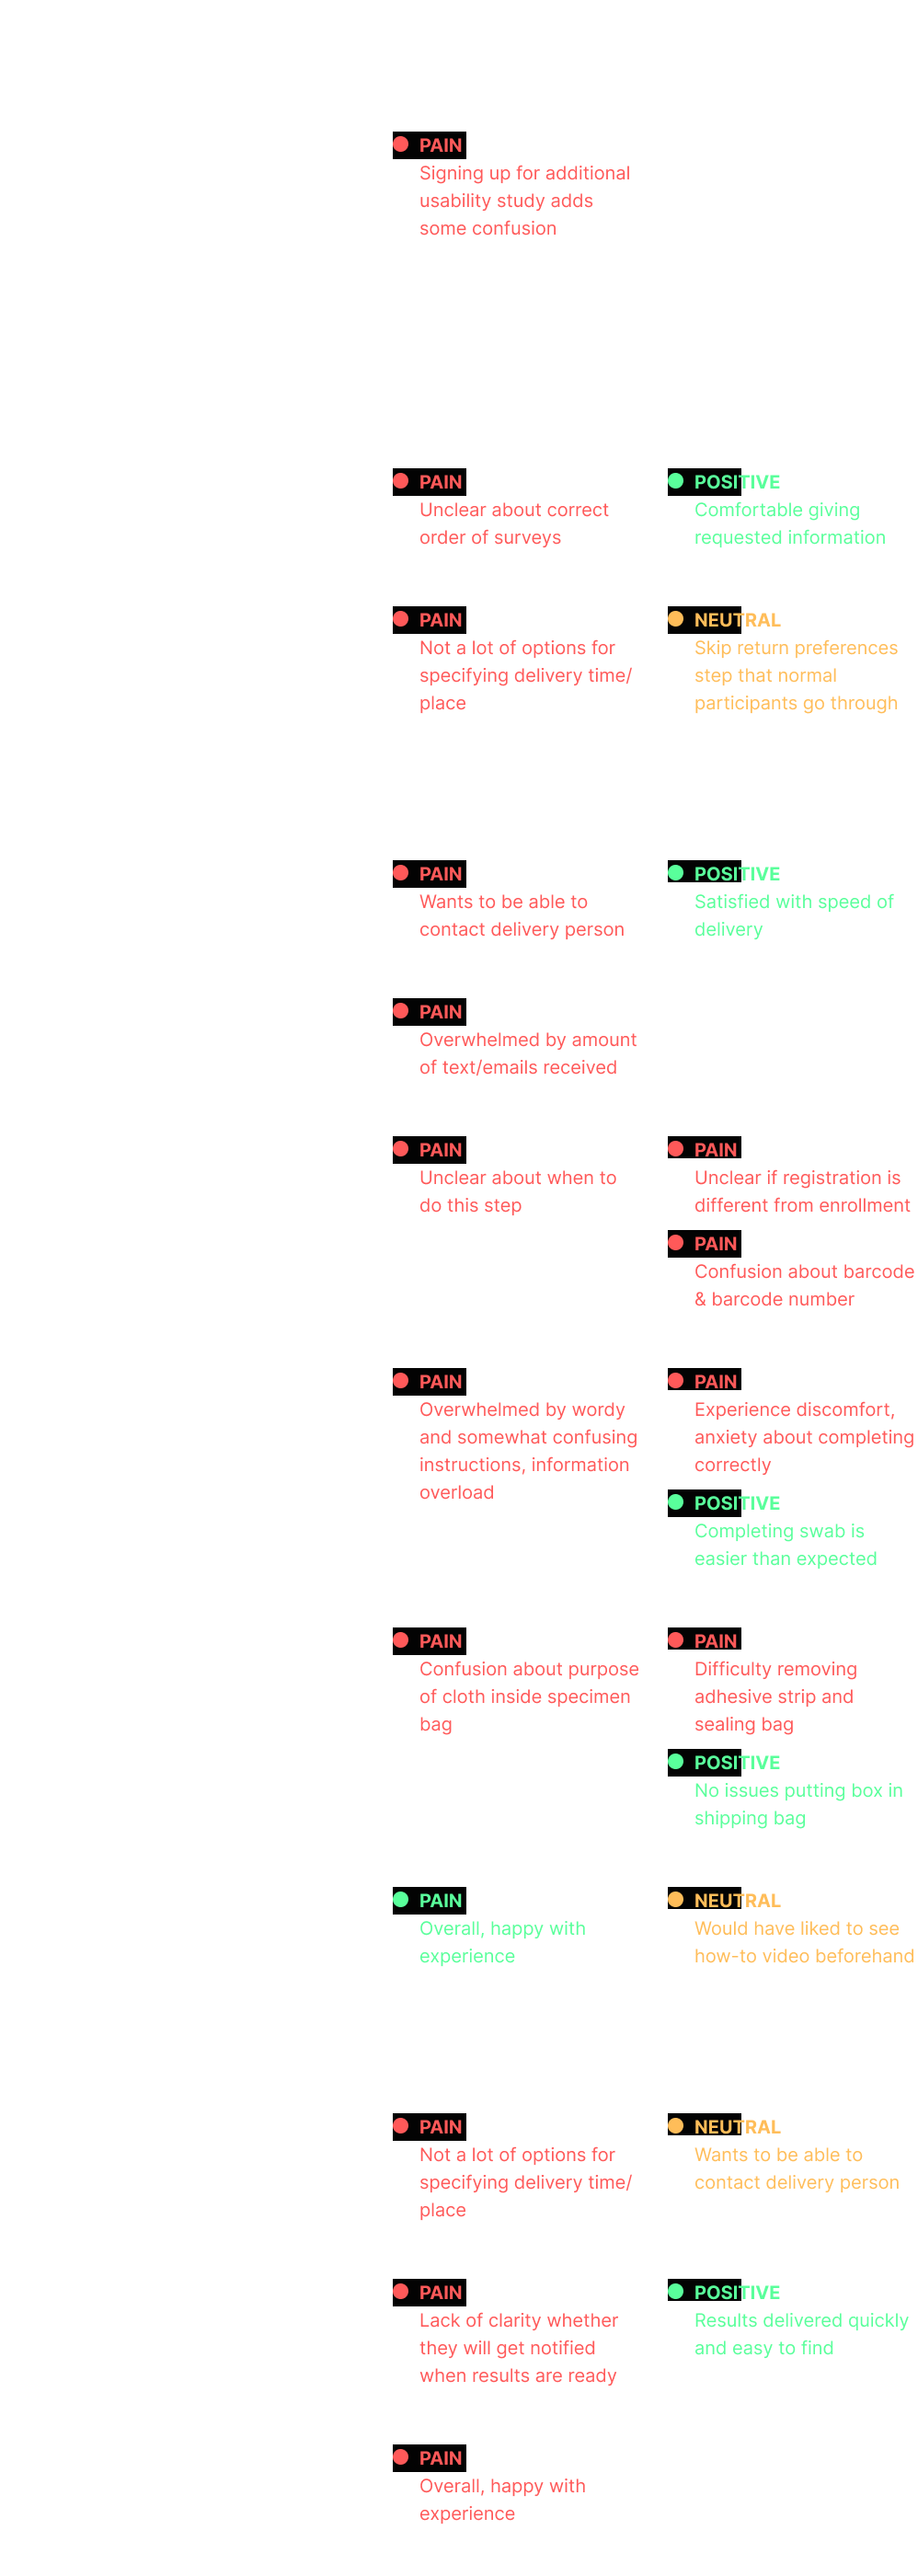
Figure 1: User journey map of the SCAN procedure across four stages: recruitment, sign-up, kit completion, and awaiting results. Each action is coded positive, negative, or neutral.
Synthesis
An affinity diagram turned scattered observations into grouped insights
Alongside the journey map, the team built a digital affinity diagram to hold everything the interviews produced. We pulled the significant observations out of our notes first, discussed what could be synthesised from them, and only then brainstormed recommendations the data would support.

Figure 2: The digital affinity diagram used to group observations from the ten sessions.
Key Findings
Six findings held across a majority of the ten participants
The journey map and the affinity diagram produced the findings below. Each was observed in at least five of the ten participants. Smaller findings that appeared in only one or two sessions informed the recommendations but are not reported here.
4/10
did not know when to register their kit, and registered later than the procedure intended
5/10
said they were satisfied with the speed of the process, from enrollment to results
8/10
said the volume of texts and emails they received was overwhelming
8/10
described the swab collection itself as easy, straightforward, and convenient
2/10
knew the educational video existed, though 9/10 said they would have watched it
9/10
packaged their kit correctly, but re-read the materials repeatedly to be sure of it
Recommendations
Five primary changes, each scoped to what the SCAN team could actually implement
We explored more solutions than we recommended and cut the list down to the ones the observations supported most directly. Implementation cost was part of that decision: SCAN was running an active study, and a recommendation that required rebuilding the enrollment system was not going to be adopted.
Move registration off the guide
Participants read the guides but did not follow the steps in the order written, and registration was where that mattered most. Take the registration step off the pamphlet and send it as an email after enrollment, so people meet it before they open the box. The remaining steps can stay on the guide.
Cut the Quick Start Guide down
Most participants did not read the whole guide. Reduce the word count, open up the white space, and carry more of the instruction in images. Renaming it "Instructions" would also say plainly what it is.


Figure 3: The Quick Start Guide as distributed, showing the inside of the trifold (left), and the simplified bifold, front and back (right).
Rename kit registration to activation
Participants did not understand what kit registration was for, and three of the ten believed they had already done it. "Activation" reads as something that has to happen before the kit works. Sending the registration link through whichever channel the participant chose at enrollment, or printing it as a QR code on the box, would remove the other half of the problem.

Figure 4: Approximately when each participant completed the Register Kit step, against the point in the procedure where it was meant to happen.
Send a notification only when it asks for something
Reserve texts and emails for confirming a completed step or reminding a participant who looks like they are about to drop out. Cutting the number of channels would help as much as cutting the volume: messages arriving from several addresses and phone numbers left participants unsure which were real.
Put the web resources where the kit is
SCAN had resources participants never found, including the educational video none of the ten knew about. Build a participant-facing FAQ, promote the video, and reach both through a QR code on the swab kit box, which at the time carried only the SCAN logo.
Reflection
The existing data was better at scoping the study than at answering it
The surveys and support emails told us where to point the sessions, but they could not explain why registration was going wrong. Everyone who answered the survey had already finished the procedure and was reconstructing it from memory, and none of them described skipping a step. Watching ten people open a box was what showed it happening. If I ran this again I would use the existing data to recruit for the sessions rather than to stand in for them, and I would schedule them early enough to test a revised guide instead of only recommending one.
